
Bitcoin has started showing early signs of weakness after its recent recovery rally toward the $80K resistance region. The market is now confronting a technically important supply zone where sellers have become increasingly active, raising the probability of a broader corrective phase in the short term.
Bitcoin Price Analysis: The Daily Chart
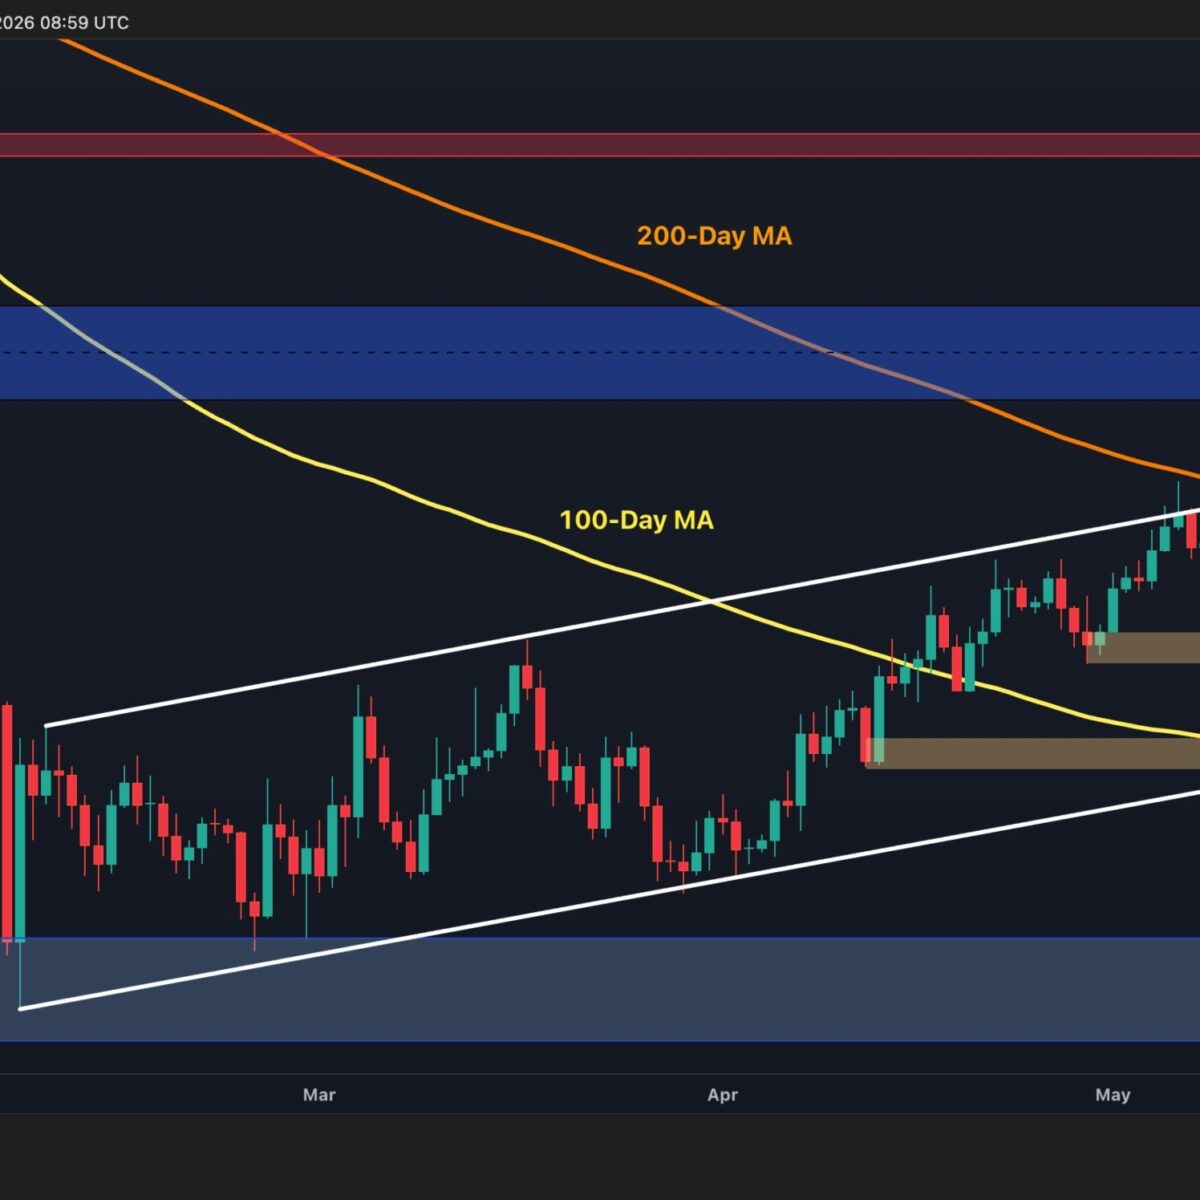
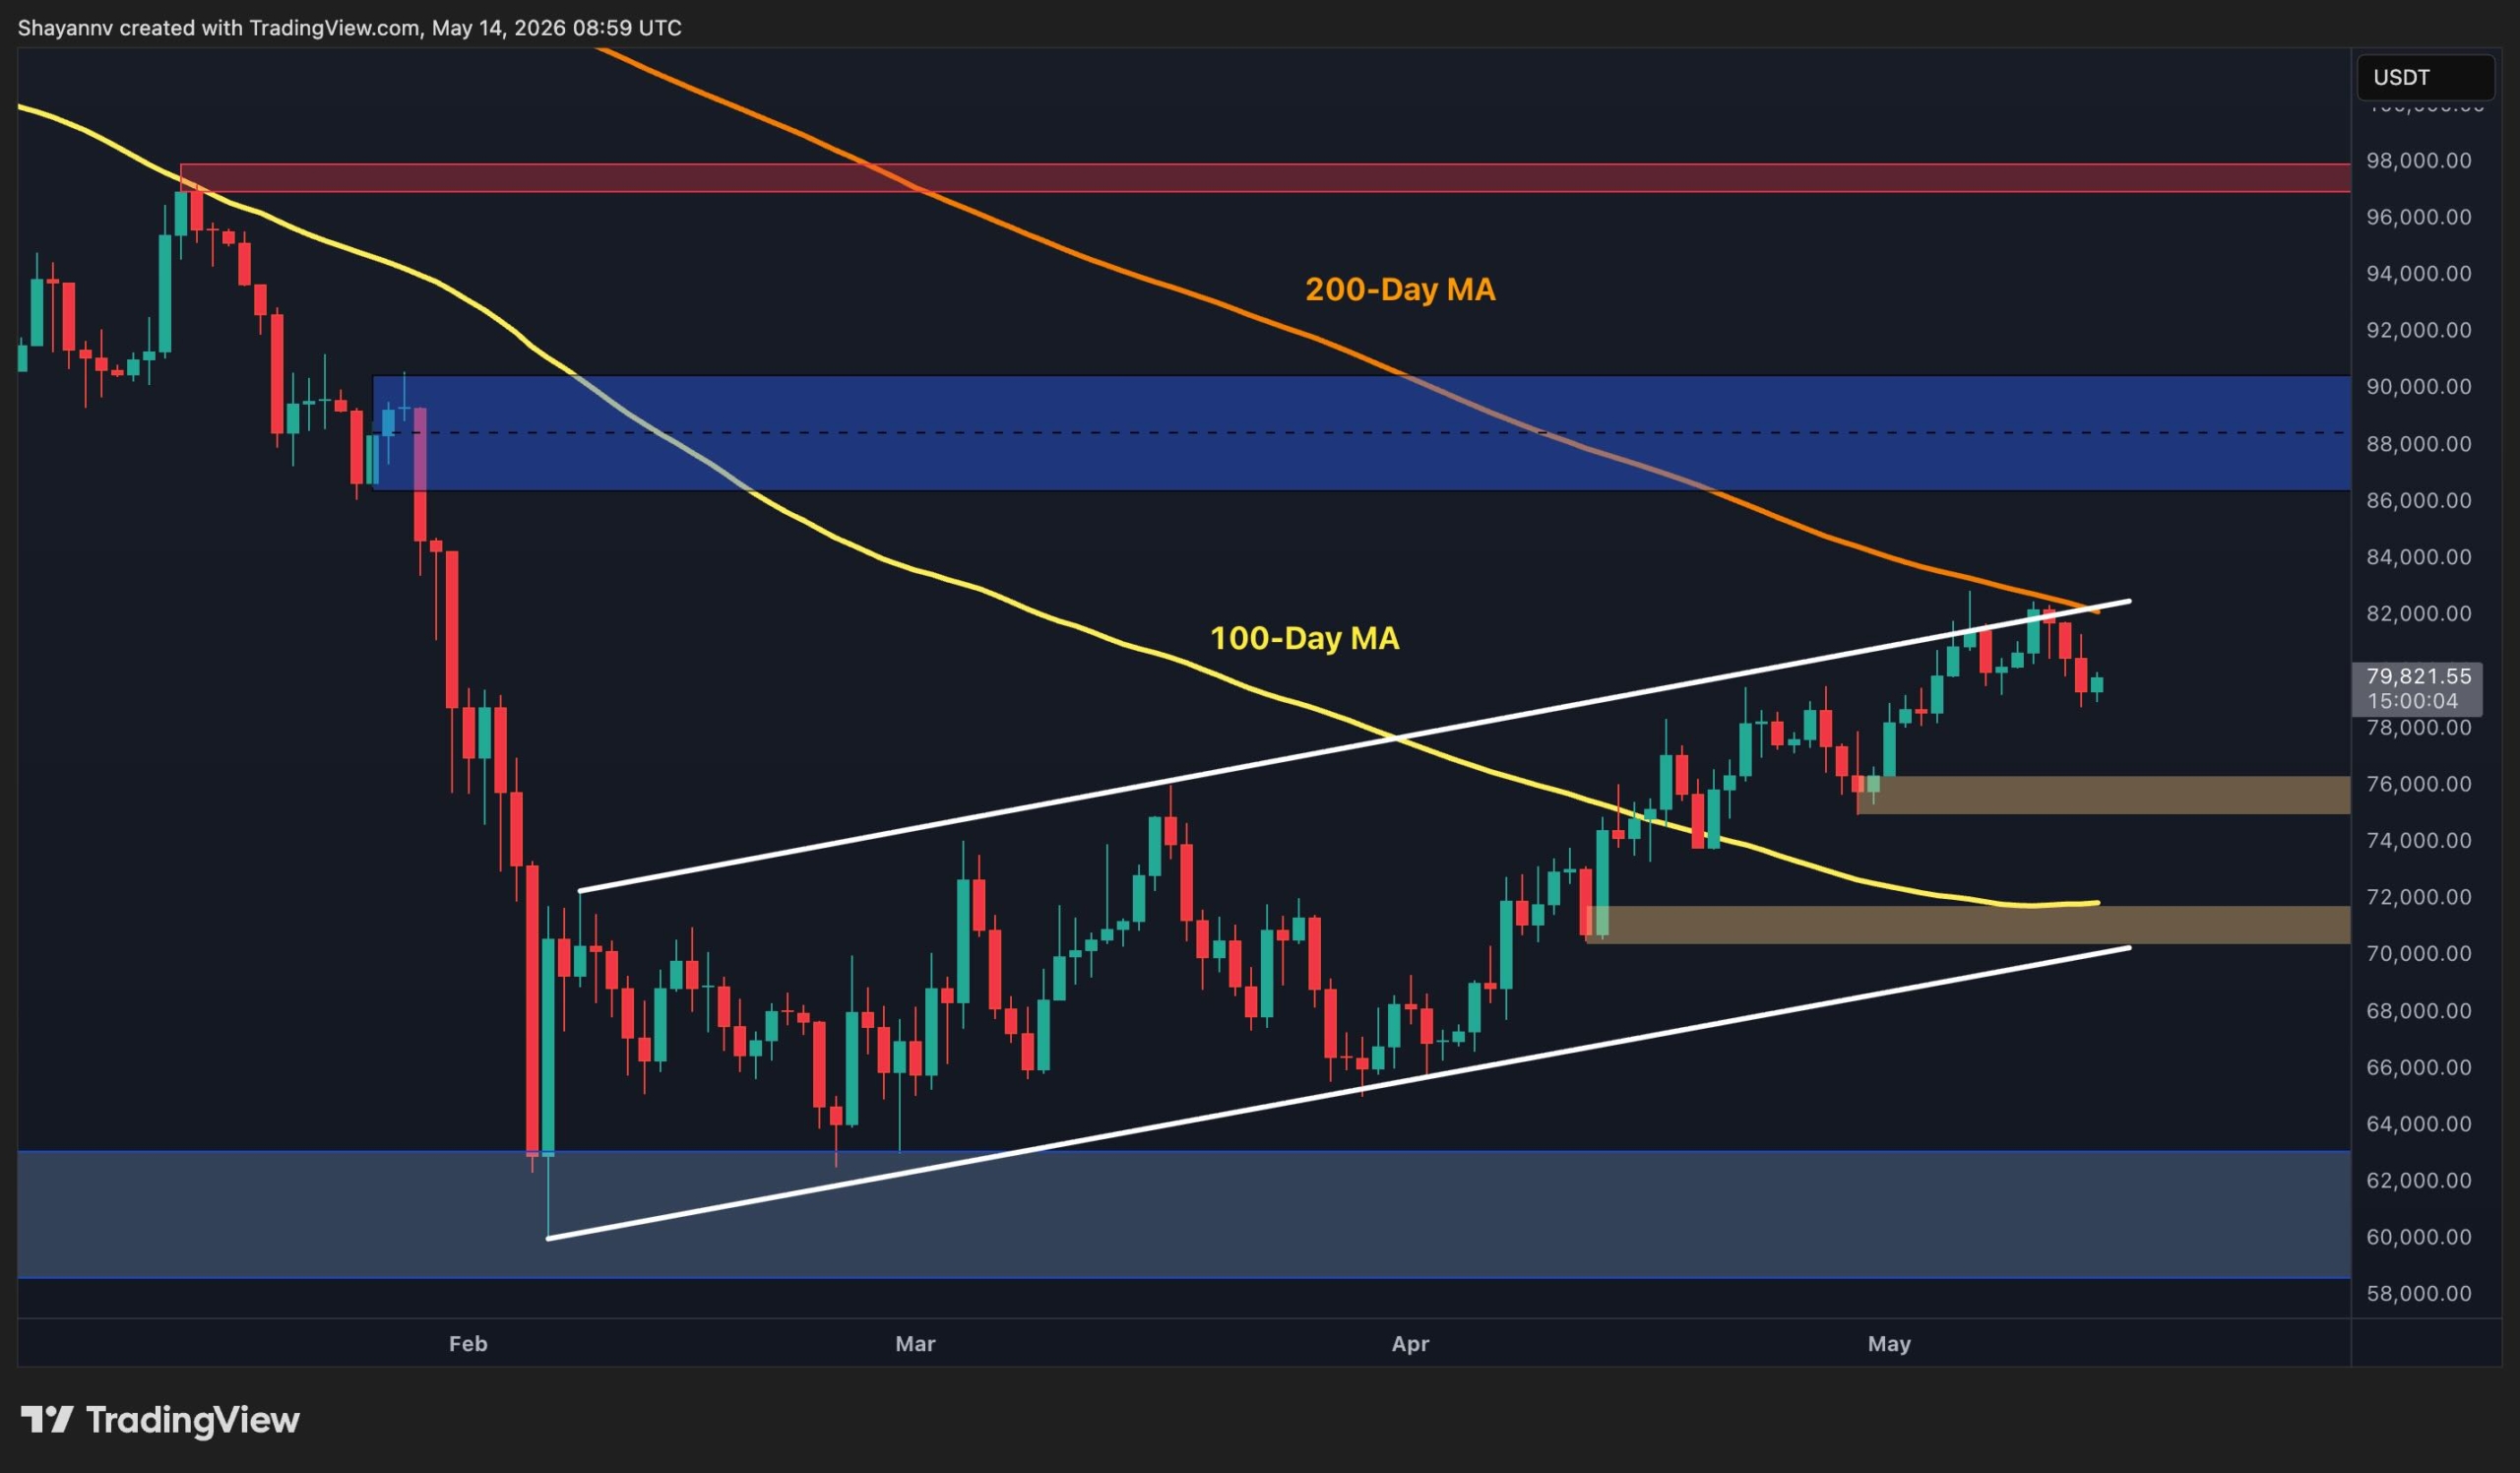
On the daily chart, BTC has recently shown several bearish signs as the price struggles to maintain bullish momentum around the crucial $80K resistance level. This area coincides with a strong confluence of supply, including the upper boundary of the broader ascending channel and the 200-day moving average near the $82K mark. The repeated inability to reclaim this region highlights the presence of aggressive sellers and growing distribution pressure in the market.
As a result, the probability of an expanded bearish retracement has increased notably. If sellers maintain control, Bitcoin could gradually decline toward lower support zones, with the $75K region acting as the first key demand area. A deeper correction could then expose the broader support zone around $70K-$71K, which previously acted as a significant accumulation range for buyers.
BTC/USDT 4-Hour Chart
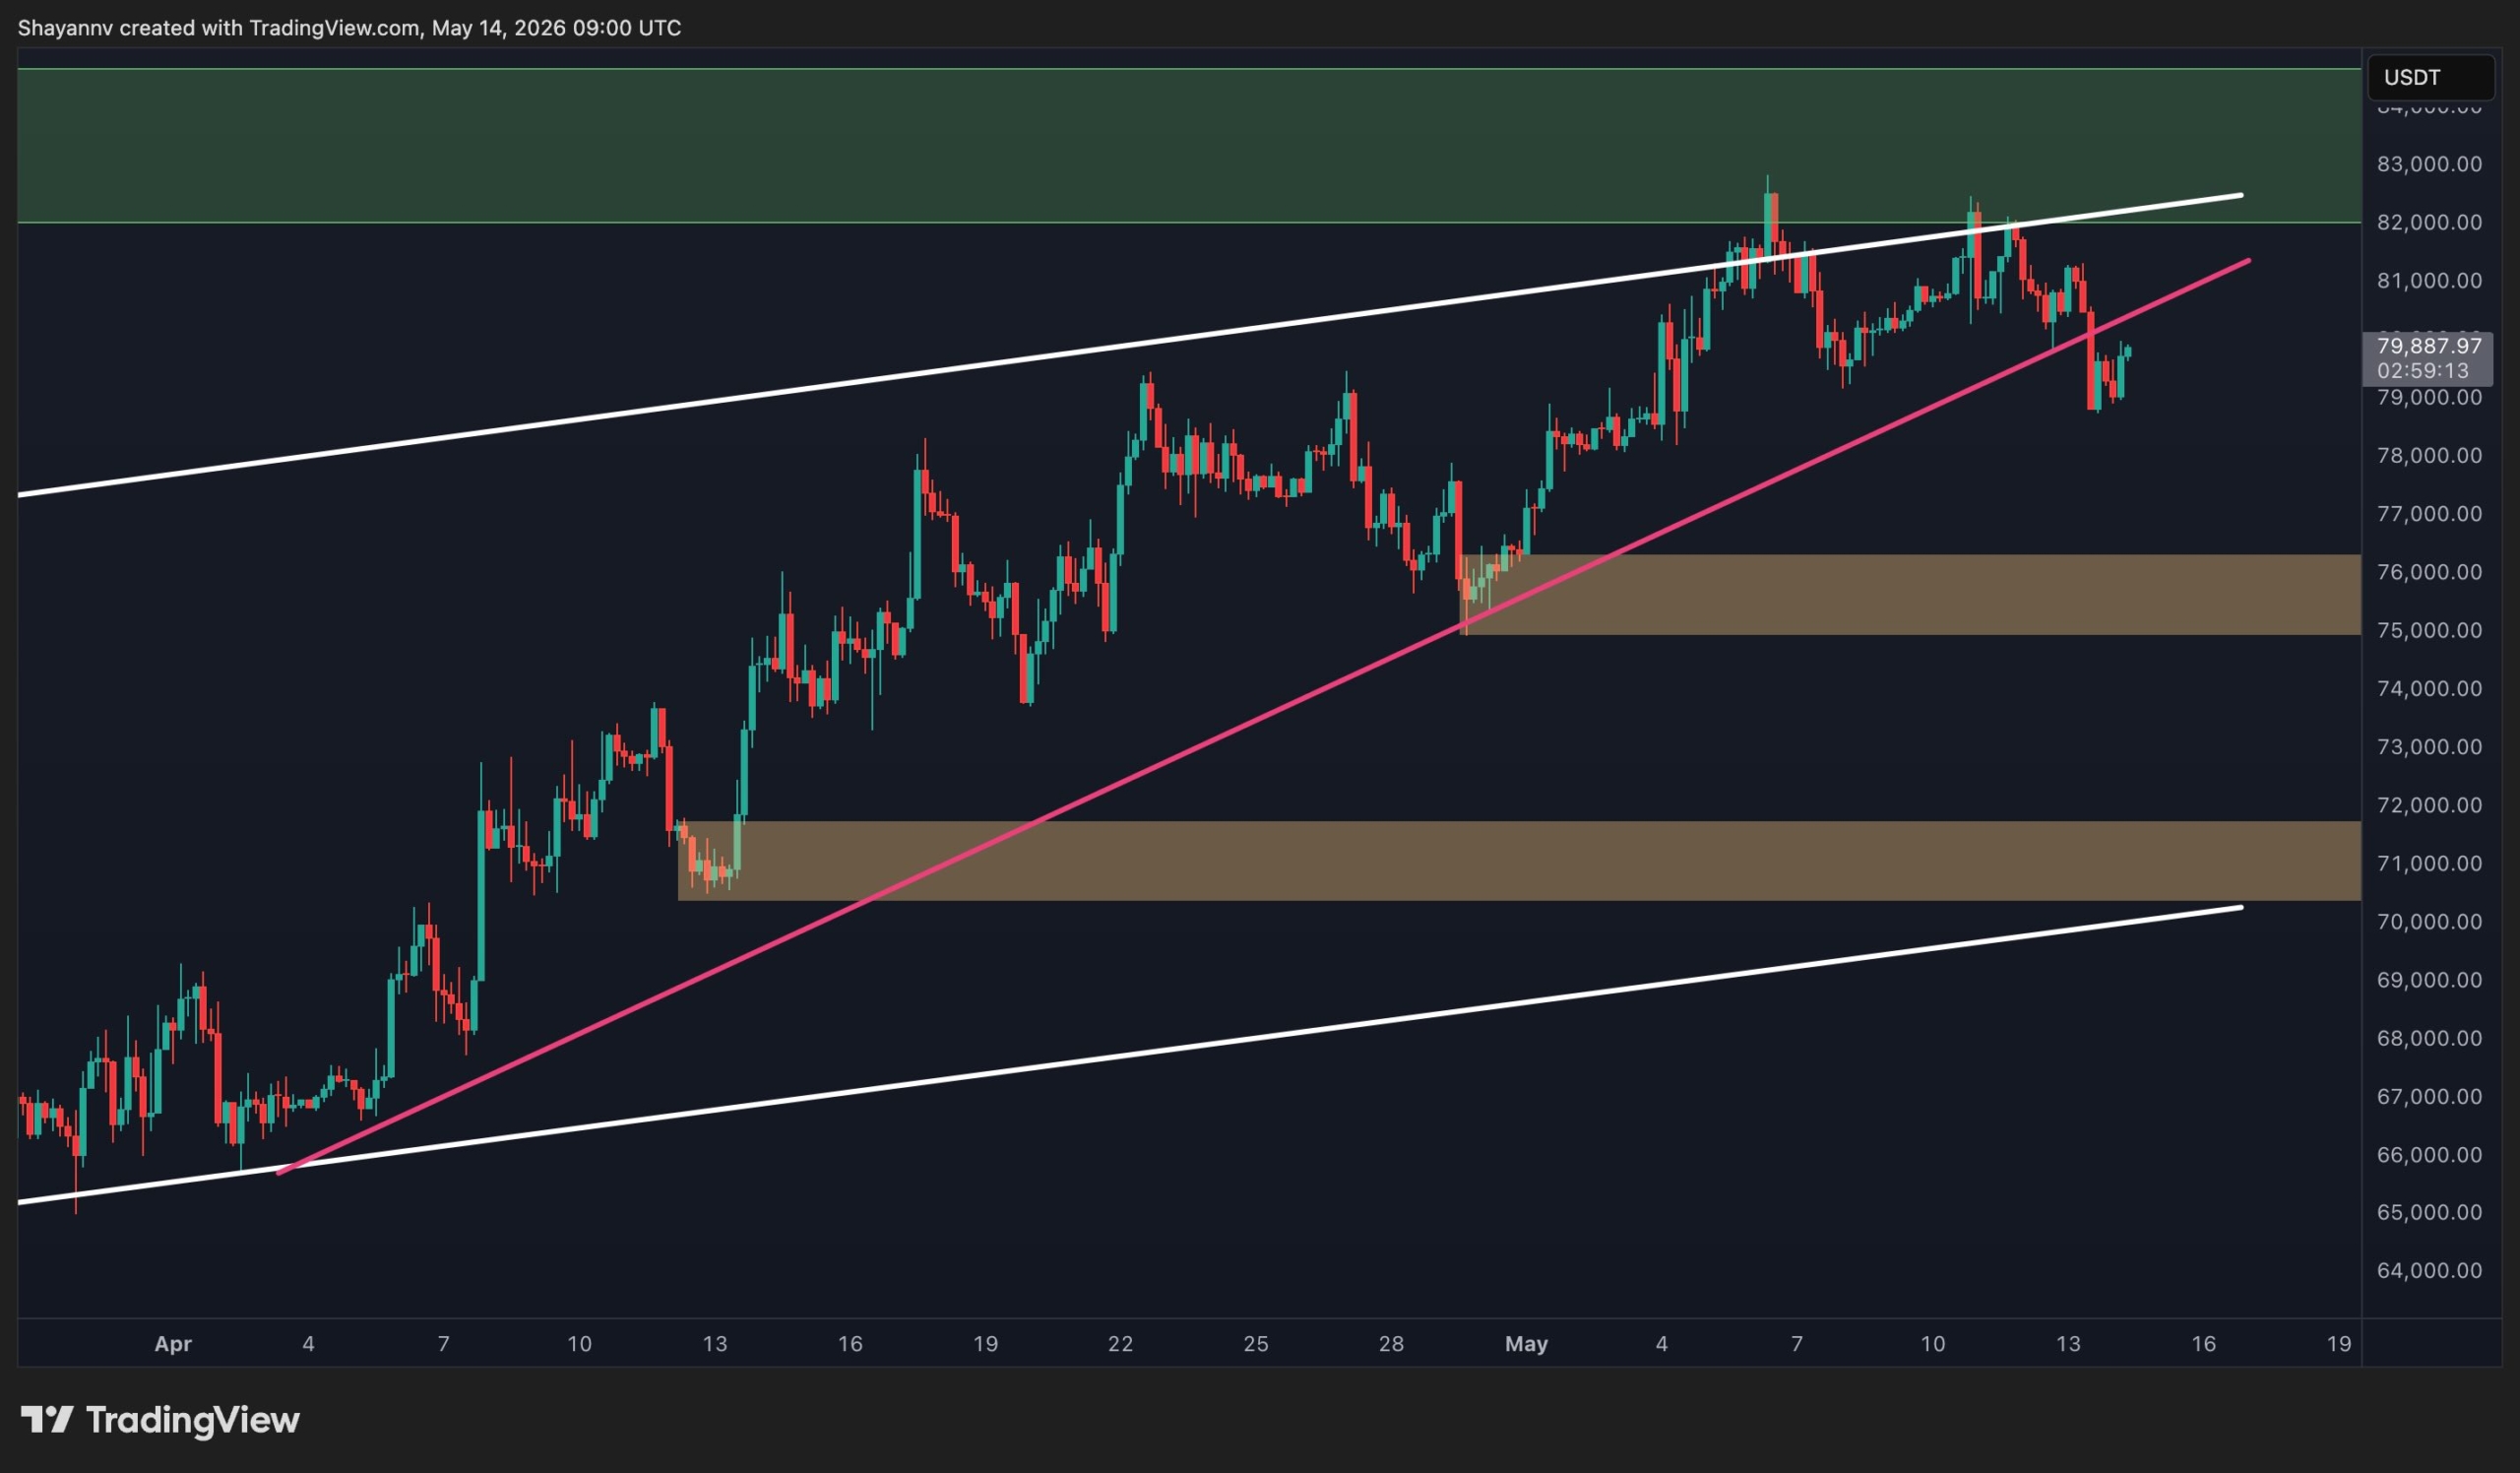
On the 4-hour timeframe, the market has recently broken below a key ascending trendline that had supported the latest bullish structure since the rebound from the $60K region. This bearish breakdown serves as an early warning sign that momentum is fading and sellers are gradually gaining dominance over the market.
Additionally, many participants who accumulated BTC during the recent capitulation toward the $60K support zone now appear to be securing profits and reducing exposure near resistance. This behavior has increased selling pressure around the $80K region and further supports the possibility of another corrective leg in the coming days. If bearish momentum accelerates, the price could continue its decline toward the highlighted demand zones at $76K and eventually the $71K region.
Onchain Analysis
From a liquidation perspective, the Binance BTC/USDT heatmap reveals a substantial concentration of liquidity resting beneath the current market price, particularly around the $77K region. Historically, the market tends to gravitate toward these high-liquidity zones, as they fuel larger directional moves through forced liquidations.
This growing liquidity cluster below the market further aligns with the current bearish technical structure observed across both higher and lower timeframes. As long as Bitcoin remains below the critical resistance confluence around $80K-$82K, the probability of a liquidity-driven decline toward the lower clusters remains elevated.

Prefer CryptoPotato on Google News – Never miss a breaking move
Binance Free $600 (CryptoPotato Exclusive): Use this link to register a new account and receive $600 exclusive welcome offer on Binance (full details).
LIMITED OFFER for CryptoPotato readers at Bybit: Use this link to register and open a $500 FREE position on any coin!
Disclaimer: Information found on CryptoPotato is those of writers quoted. It does not represent the opinions of CryptoPotato on whether to buy, sell, or hold any investments. You are advised to conduct your own research before making any investment decisions. Use provided information at your own risk. See Disclaimer for more information.