XRP is trading at $1.37 as May draws toward its final week, having erased every gain from what briefly looked like the most promising technical setup of the corrective cycle. The breakout above the 100-day MA on the USDT chart has failed to hold, and a lower high has formed on the BTC pair. The levels that looked like support last week are now the targets that bulls need to reclaim just to get back to where they started.
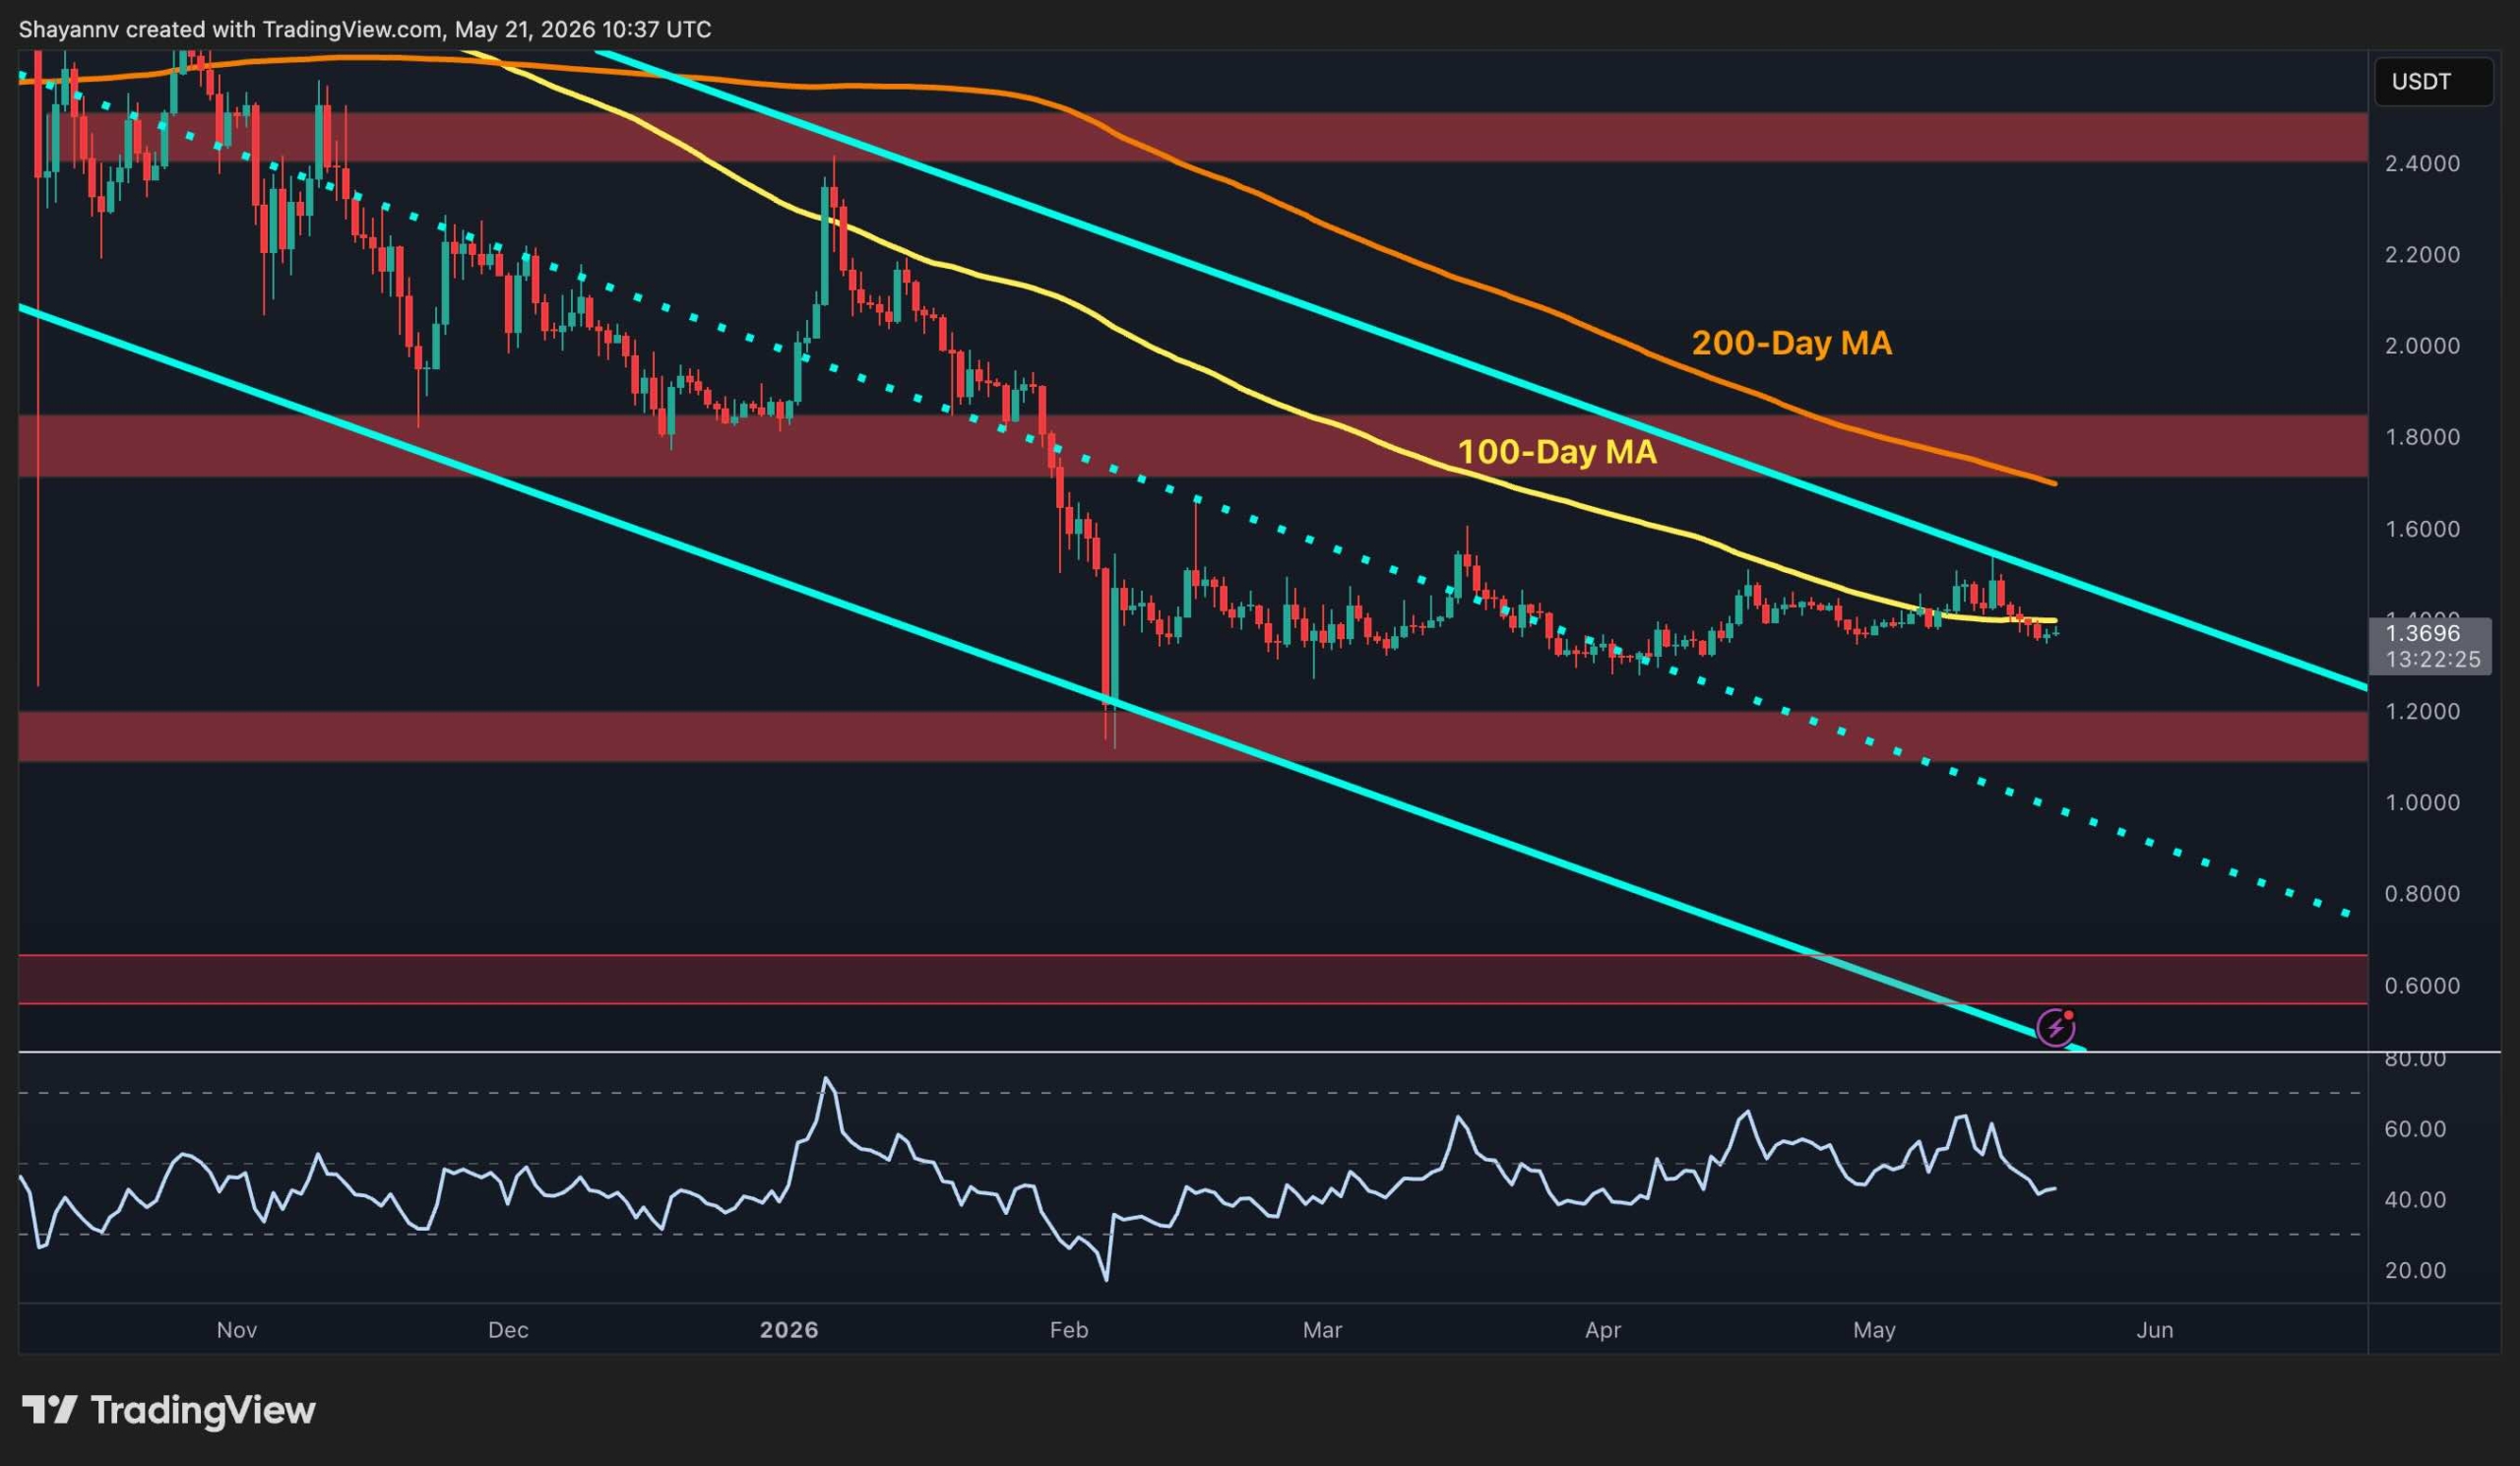
The USDT pair’s daily timeframe setup looked compelling last week. The asset was pressing the upper boundary of the long-term descending channel and holding above the 100-day moving average at around $1.45, with an RSI climbing toward 65.
Yet, this move has played out as a textbook rejection. XRP failed to post a single candle close above the channel, and the subsequent sell-off has brought the price back to $1.37. The 100-day MA, which was seen as dynamic support just days ago, is now the nearby overhead resistance at $1.40, sitting just below the descending channel ceiling.
The RSI has faded from 65 back to the 40s, wiping out the momentum that made the setup optimistic. The $1.20 demand zone below should now be watched as the potential floor, while a recovery back above $1.45 and the 100-day MA remains the minimum requirement to rebuild any constructive case. Yet, with the broader altcoin market breaking down, the path of least resistance points toward another test of support rather than another attempt at resistance.
The brief breakout above 1,800 sats that appeared on the BTC pair last week has proven to be a fakeout. XRP/BTC has slipped back to around 1,770 sats, creating a lower high at around 1,800-1,900 sats. The RSI, which had recovered from the extreme low of ~25 all the way to above 50 while demonstrating a bullish divergence, has also faded back toward 40. The relief bounce is losing energy before it accomplishes anything structurally meaningful.
The failed reclaim of 1,800 sats is the defining development on this pair. It confirms that the oversold bounce was corrective rather than structural, and that the broader downtrend in the ratio remains intact. The 100-day moving average at ~1,900 sats and the 200-day moving average at ~2,100 sats continue to decline well above, offering no nearby reference for a recovery.
Below, the lower channel boundary near 1,550 sats and the 1,500 sat horizontal support band remain the next downside targets if the current level gives way. With altcoin sentiment deteriorating across the board, there is little in the near-term macro picture to suggest that pressure is about to ease.
Prefer CryptoPotato on Google News – Never miss a breaking move
LIMITED OFFER for CryptoPotato readers at Bybit: Use this link to register and open a $500 FREE position on any coin!
Disclaimer: Information found on CryptoPotato is those of writers quoted. It does not represent the opinions of CryptoPotato on whether to buy, sell, or hold any investments. You are advised to conduct your own research before making any investment decisions. Use provided information at your own risk. See Disclaimer for more information.
Bankless is facing backlash after reportedly laying off most of its staff without a public…
What collapsed in wave-one play-to-earn wasn’t the concept — it was the assumption that token…
SpaceX’s IPO filing reveals Starlink’s revenue role, major AI spending, Starship costs, Musk’s control, and…
Key TakeawaysPolymarket traders give Democrats a 47% chance of sweeping both chambers in the 2026…
Chiliz has announced a landmark partnership with the South African Football Association to launch the…
Pudgy Penguins Launch Browser-Based Game Dubbed Pudgy World Source link