
BONK, the Solana meme coin, is at an intriguing moment in its existence. The project boasts a strong community and a 50% price increase over the past month. Recently, BONK has integrated with Bravo Ready games and reached a daily revenue of $ 1.72 M. For a few days this month as well, it was considered the most bought project by smart money, though technical analysis reveals some conflicting points.
I simiply believe $BONK is going to make MASSIVE new highs this year
Best Solana beta + most cracked marketing team + huge normie appeal
My bags are absolutely PACKED pic.twitter.com/jLicOrVAHC
— champ
(@champtgram) May 28, 2025
There are people like Champ who think there is still “bread” left in the coin. He points out some good fundamentals, too. I would not say my technical analysis is always correct. But I think it is also important to consider multiple scenarios, even if the long-term price is projected to make a new ATH.
DISCOVER: Top Solana Meme Coins to Buy in May 2025
BONK Jumping Up Or Plunging Down? Technical Analysis Speaks
(BONKUSD)
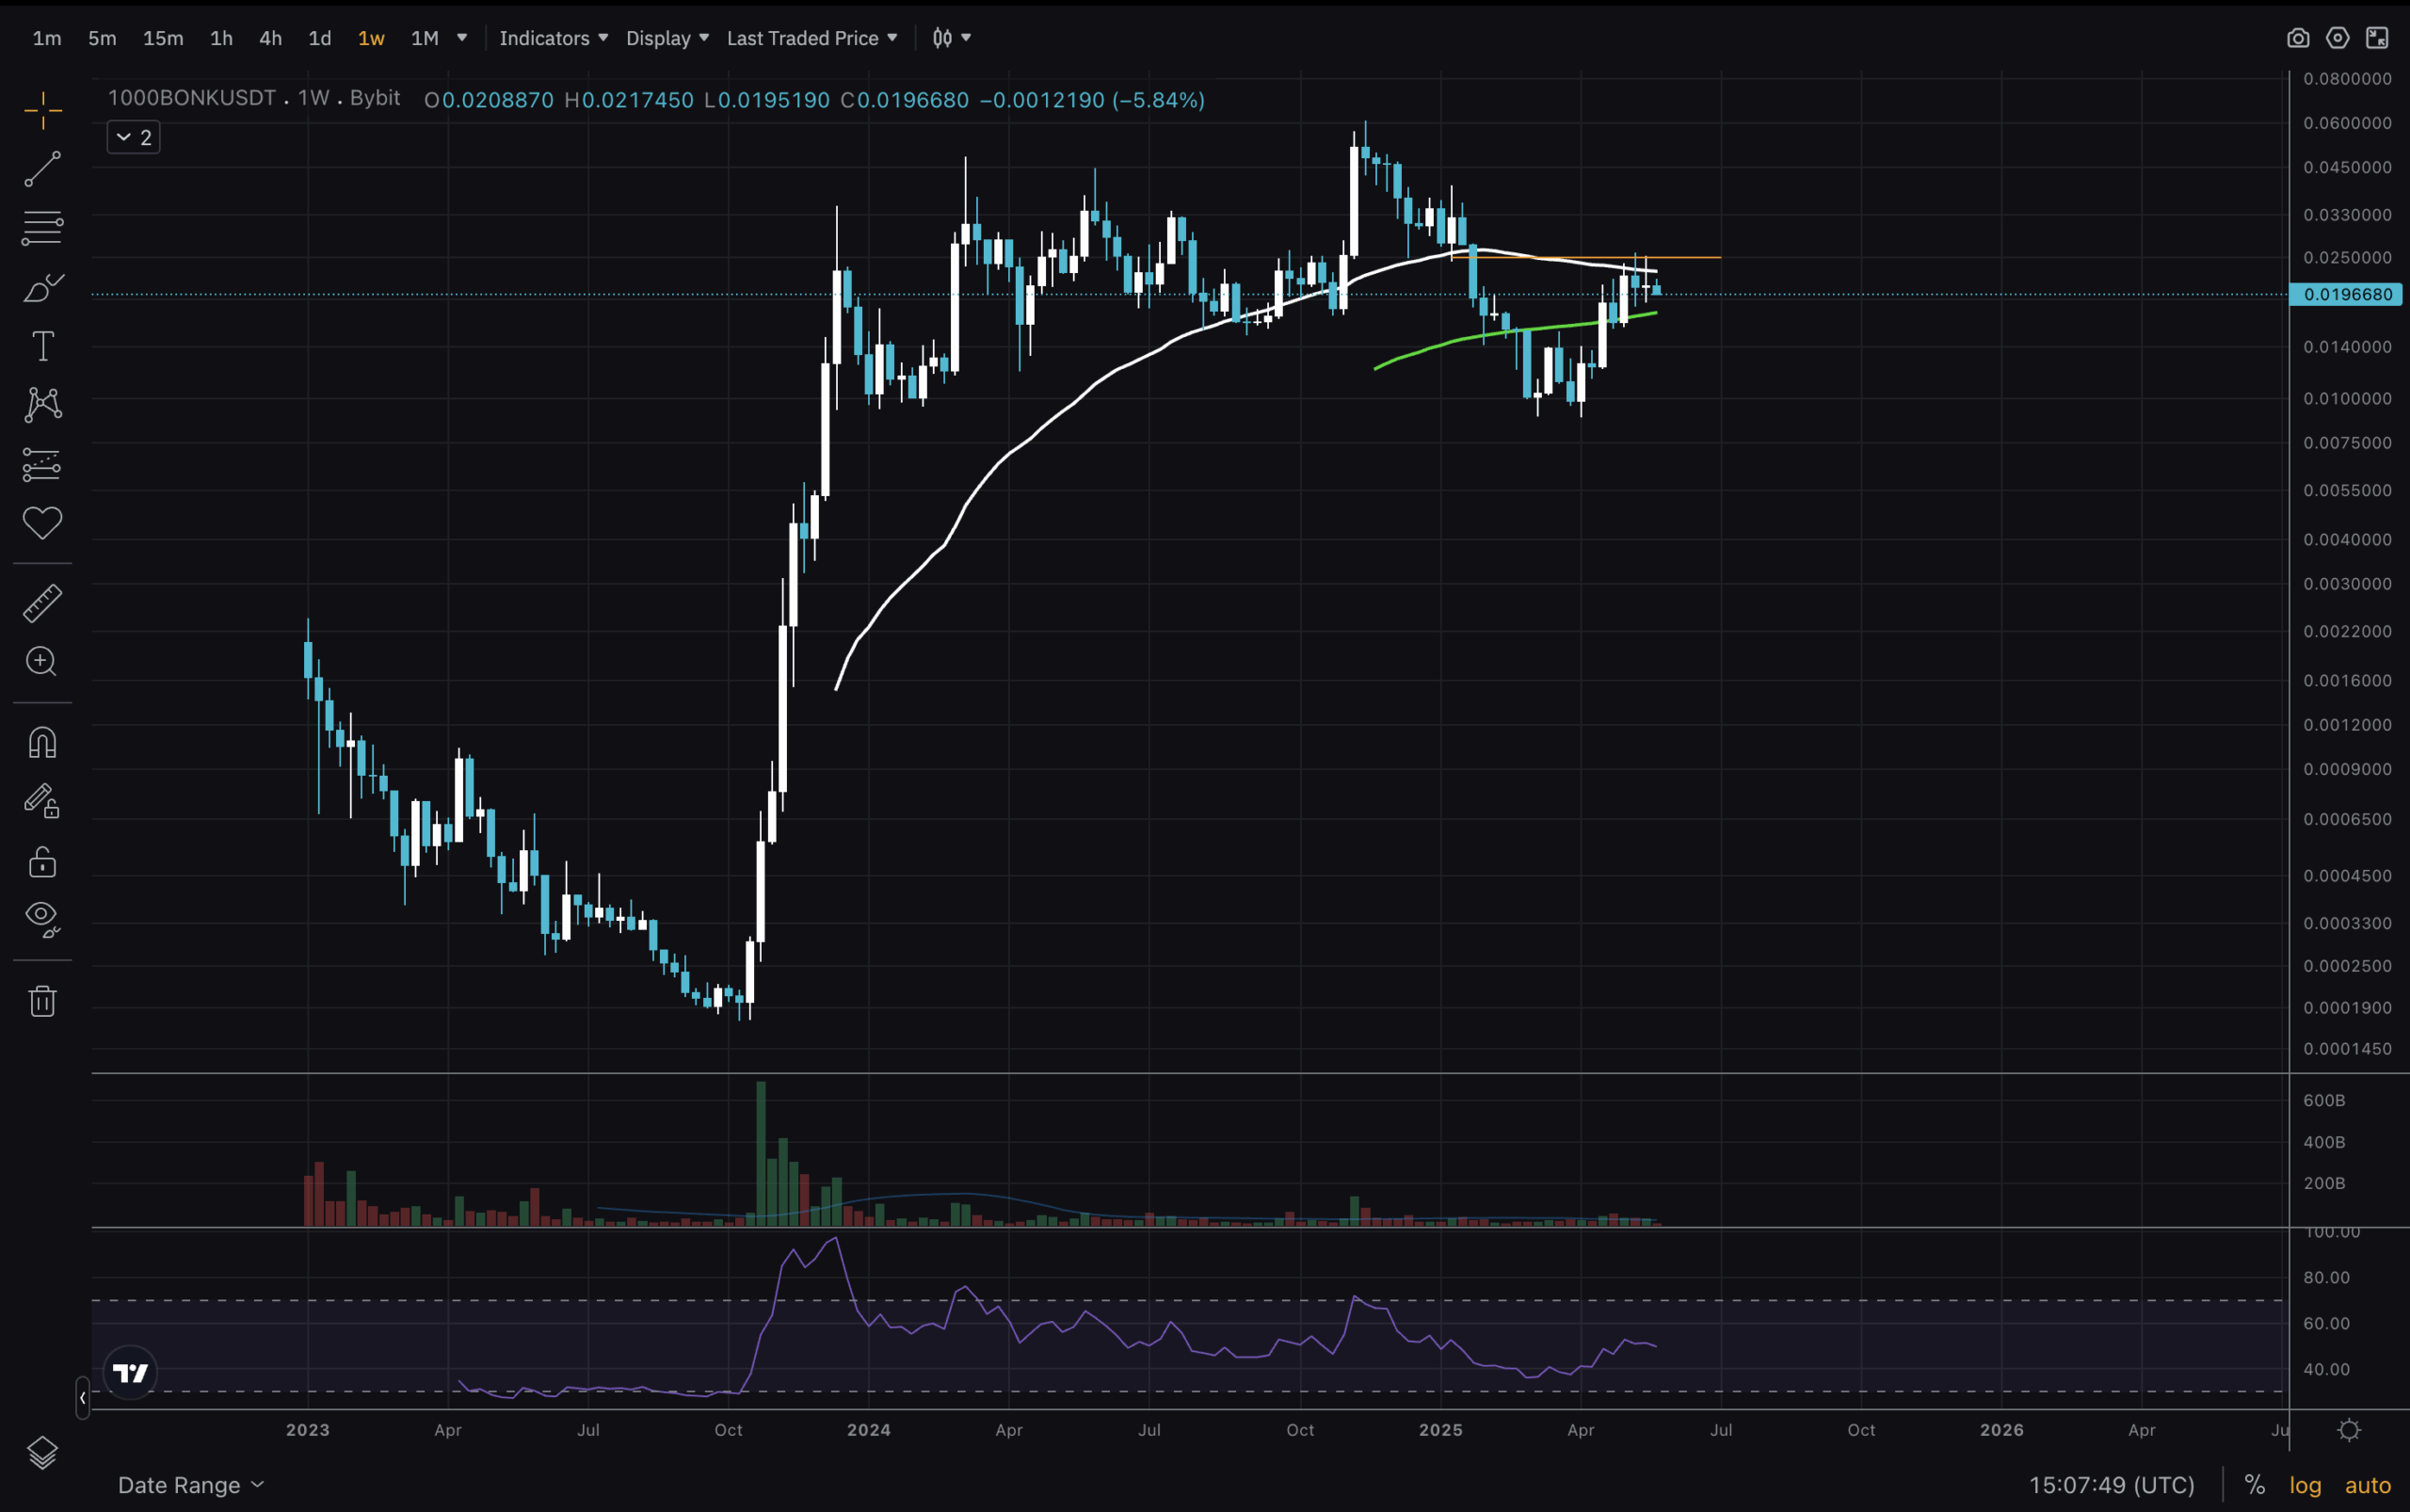
BONK chart on the Weekly timeframe. I’m using 1000BONKUSDT on Bybit for simplicity’s sake. Let’s start with simple moving averages and market structure. We see a massive run at the end of 2023.
Most of the 2024 price range was spent, and this year it went below its previous low (orange line), and the last 3 candles were rejected from that level, which aligns with MA50. The two bottoms of this upper range are at the same price of $0.0095. That’s an important support level.
DISCOVER: Top 20 Crypto to Buy in May 2025
(BONKUSD)
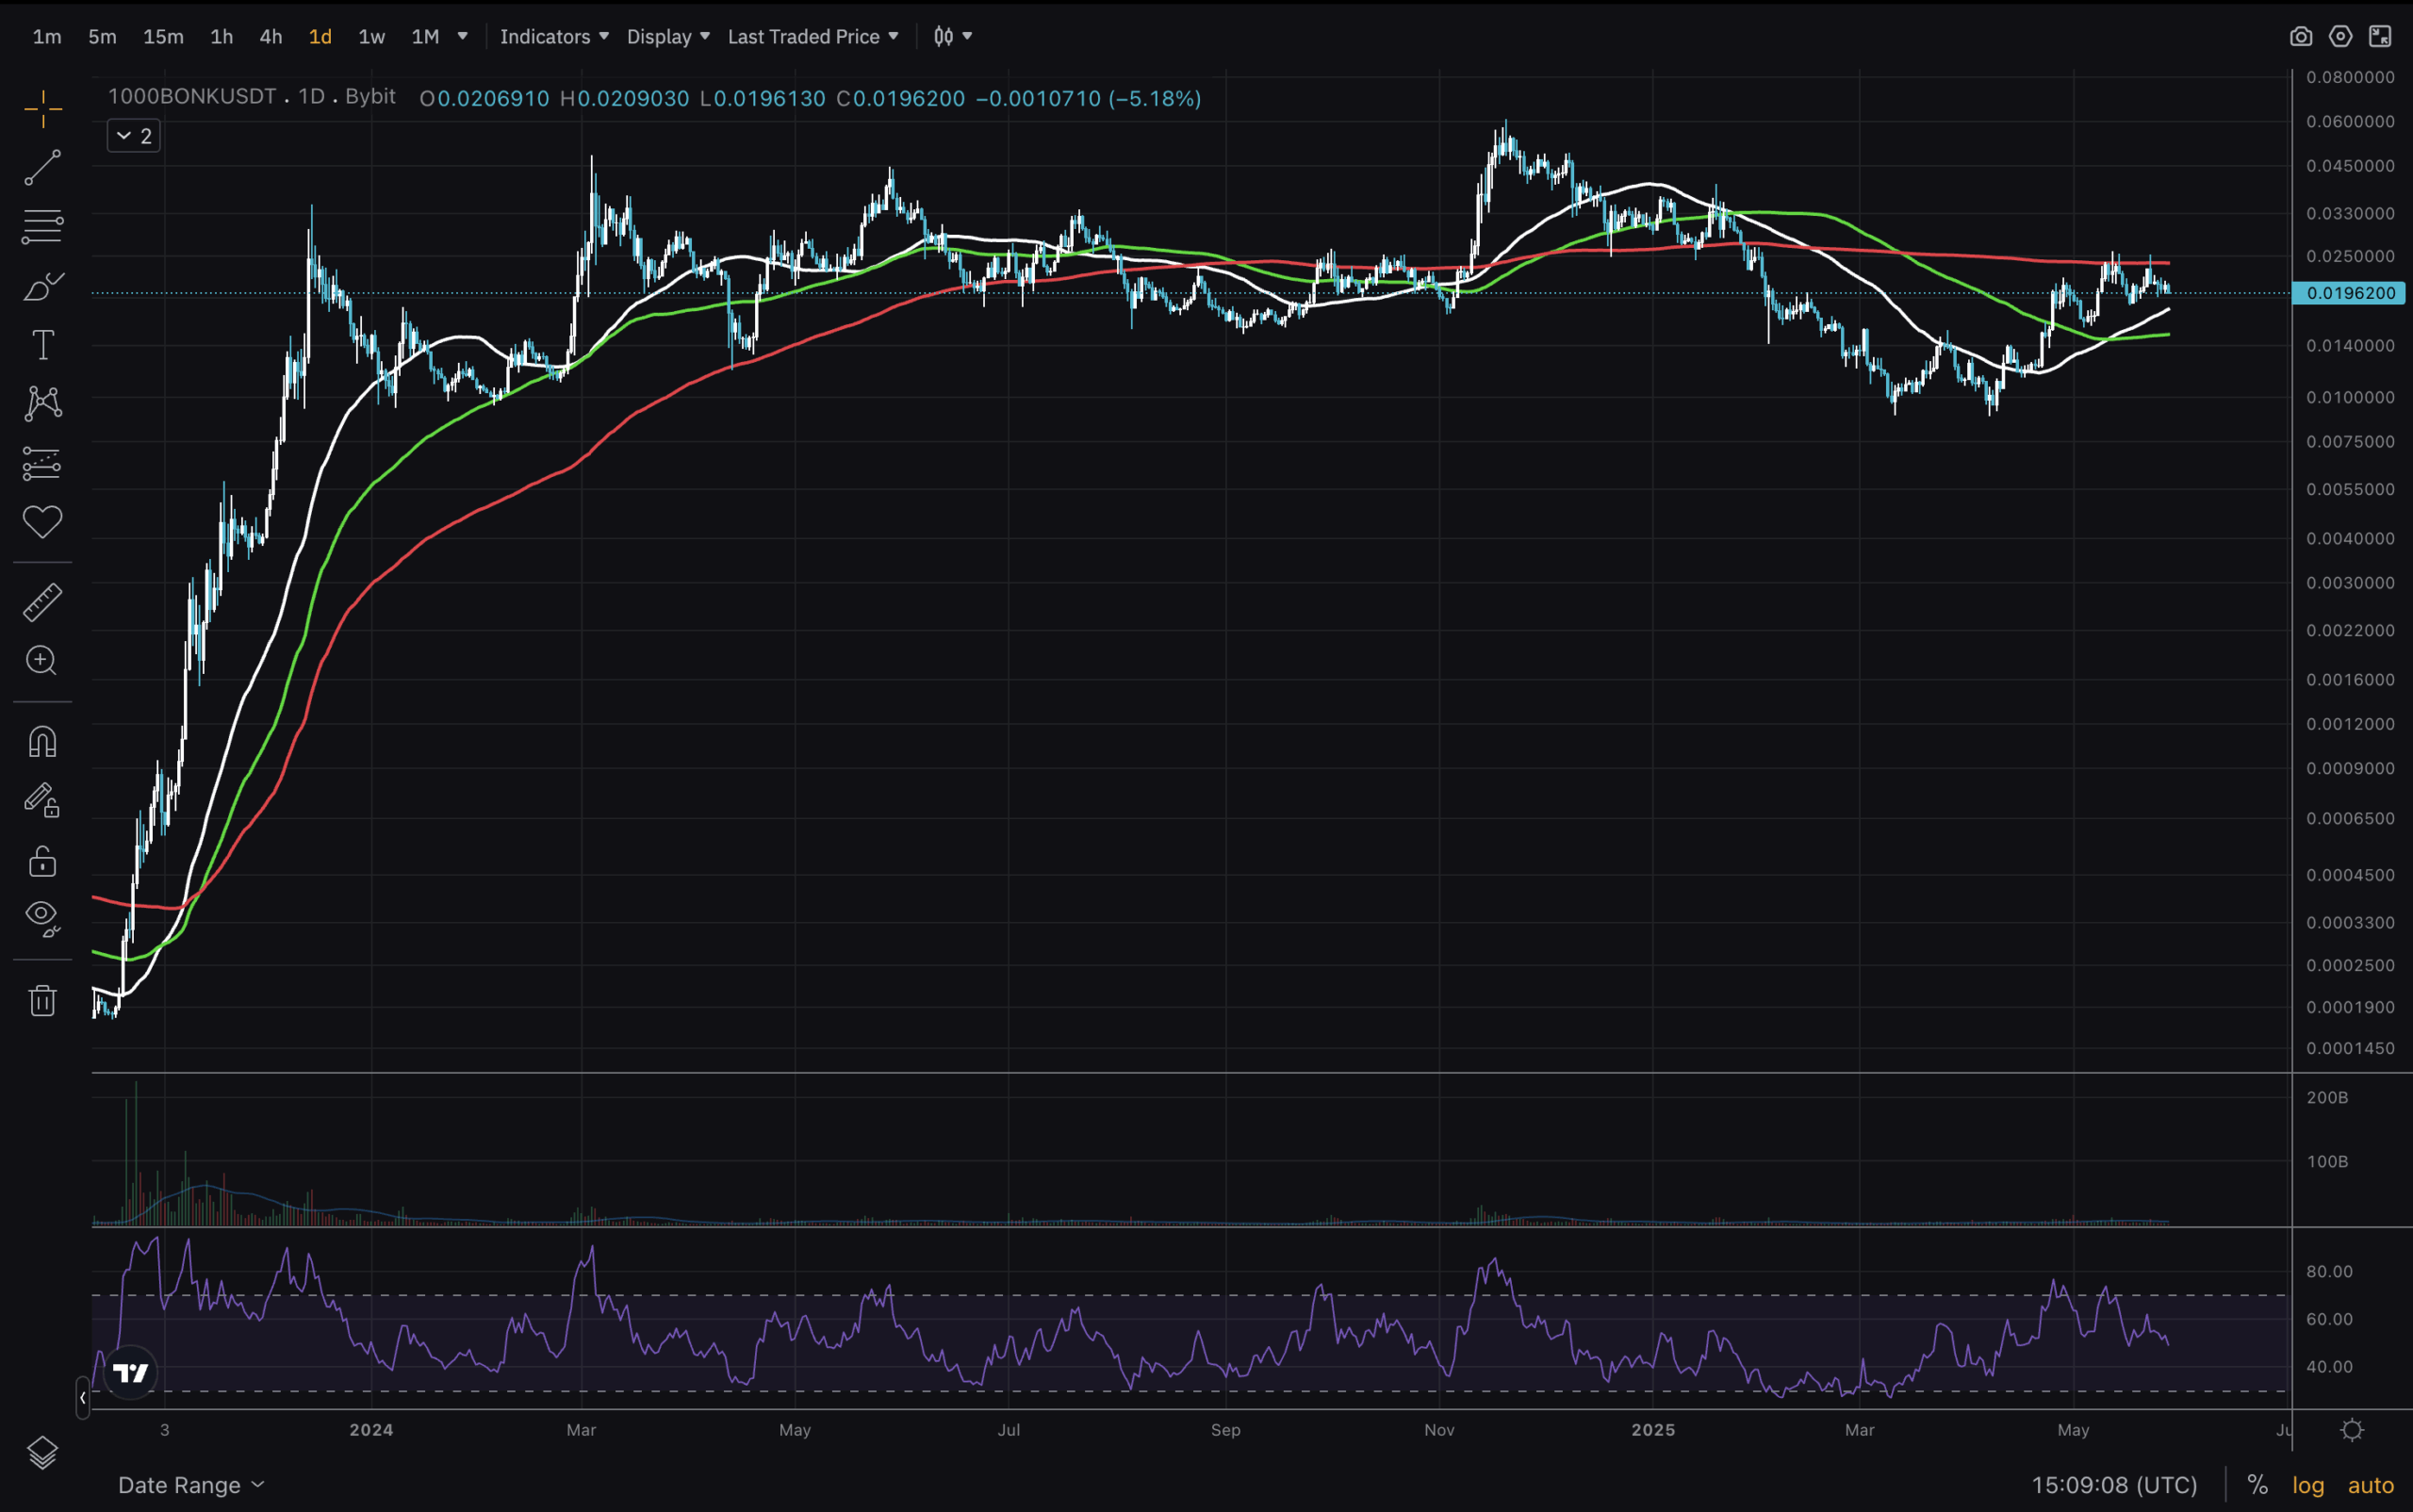
Next, for our analysis, we will look at the Daily timeframe. Here, the BONK price ranges around the Moving Averages. This month, it broke below MA200 and tested its underside twice, both times rejected.
For a move to the highs to happen, it must reclaim that level. MA50 and MA100 are potential supports that sit a bit higher that the $0.0095 level. What can be scary (or exciting) to traders is this huge empty space after the massive pump at the end of 2023.
Concluding Thoughts on BONK Price Action
(BONKUSD)
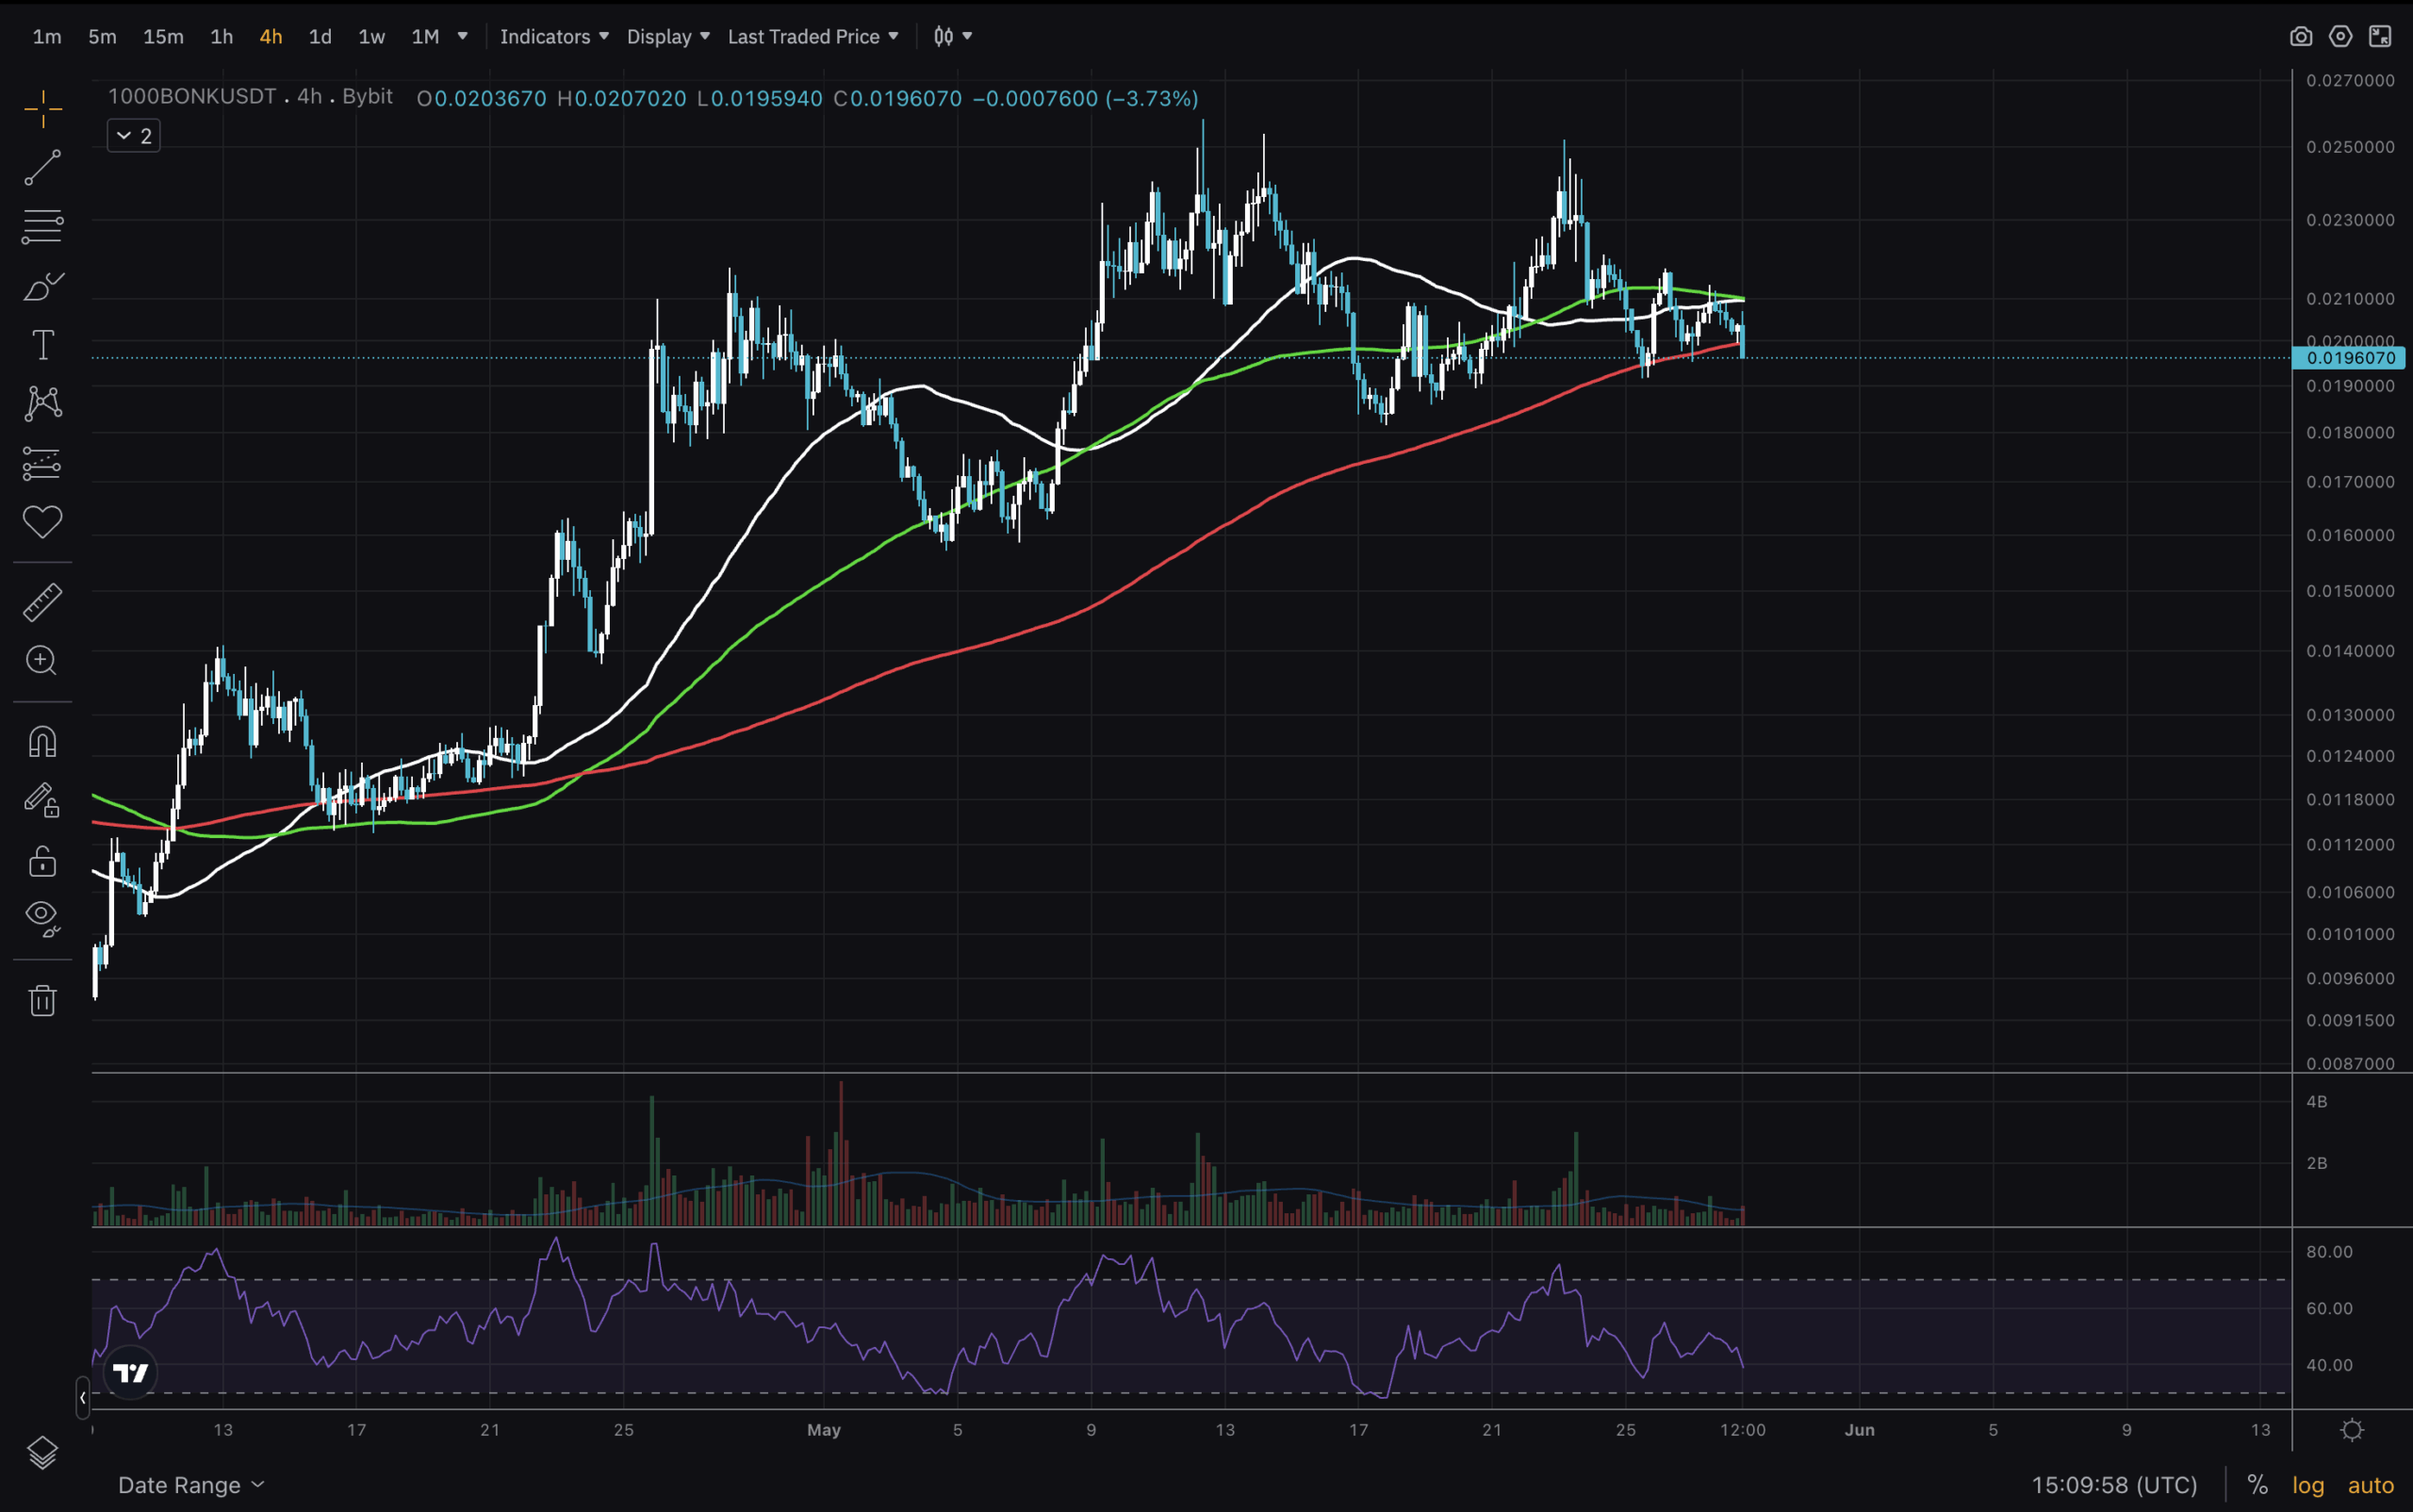
At the end, we will analyse the 4H chart. Here, MA50 and MA100 rejected the price. And is now breaking below MA200. Go back and look at the RSI levels on the previous charts and on this one now. On the Weekly, it looks like it can go either way. It is still in the bullish area daily, but the rejection from MA200 and breaking below it on 4H timeframe could turn out to be a good r:r entry for a short. Even though fundamentals are strong, sometimes price retraces, and it might be time for it with BONK.
Stay safe and don’t let other traders get your money!
Join The 99Bitcoins News Discord Here For The Latest Market Update
Is This The End of BONK? Technical Analysis Gives Warning Signs
- Price has been in the upper range for a year – can be accumulation or distribution
- RSI might need to cool down more
- Potential move down to $0.0095 or lower
- Needs to reclaim MA200 on 1D for
The post Is This The End of BONK? Technical Analysis Gives Warning Signs appeared first on 99Bitcoins.