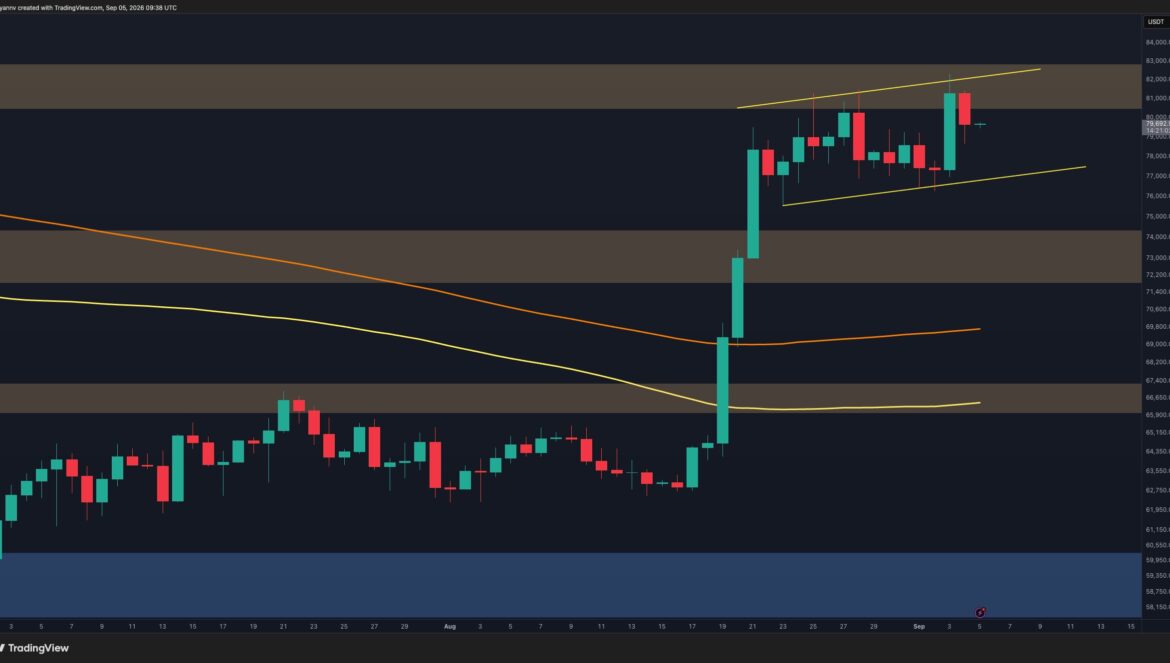

Bitcoin remains locked in a post-breakout consolidation phase, but the latest rejection from the upper end of the structure shows that buyers are still struggling to generate sustained momentum above $80K. The broader trend remains constructive, although the current range leaves BTC vulnerable to further liquidity-driven swings before its next directional move.
Bitcoin Price Analysis: The Daily Chart
Bitcoin’s daily structure remains significantly stronger than it was before the August breakout. The asset is holding well above the former $72K-$74.5K resistance zone and both moving averages, preserving the broader bullish shift despite the recent loss of momentum.
However, BTC has repeatedly encountered selling pressure inside the $80.5K-$82.5K resistance zone. The latest attempt briefly pushed toward $82K before being rejected, sending the price back below $80K. This inability to establish acceptance above the resistance area suggests that supply remains active at higher prices.
At the same time, the asset continues to trade within a gradually ascending channel. Its lower boundary currently sits around the $76K-$77K region, making this the most important nearby structural support. As long as BTC remains above this area, the ongoing price action can still be interpreted as consolidation following the sharp rally rather than a confirmed bearish reversal.
A decisive breakout above the $80.5K-$82.5K zone would strengthen the continuation scenario. Conversely, losing the channel support around $76K-$77K could trigger a more substantial correction, with the former $72K-$74.5K breakout zone becoming the next major area of interest.
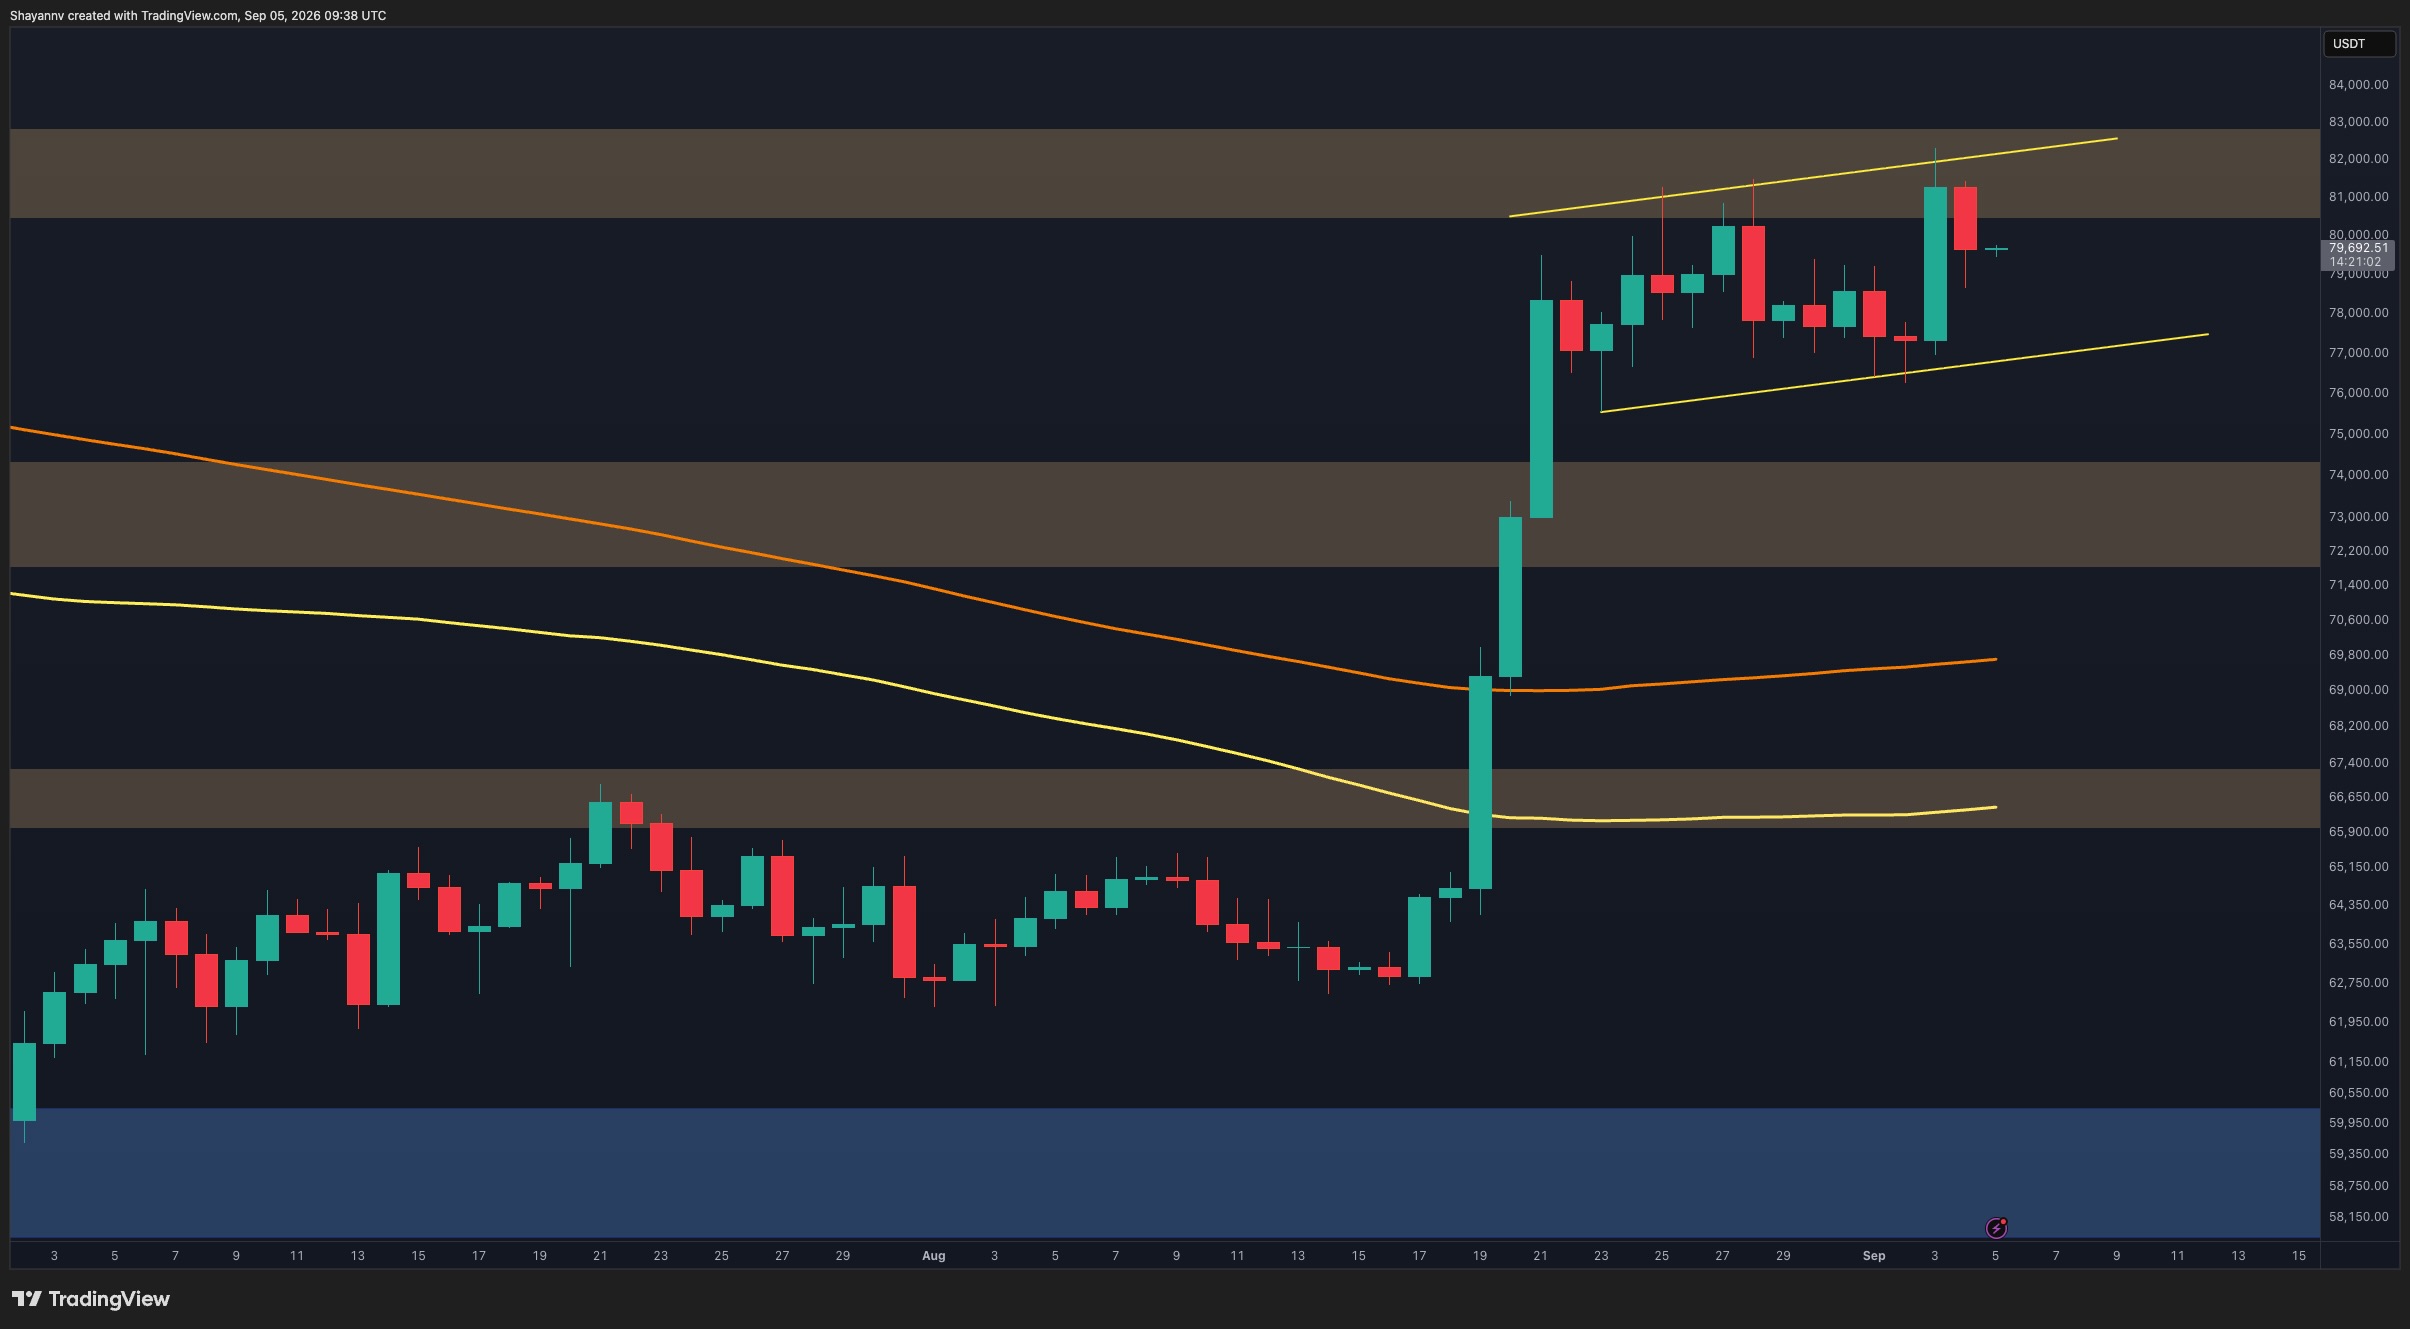
BTC/USDT 4-Hour Chart
The 4-hour chart highlights the market’s current indecision more clearly. BTC rallied from the lower boundary of the ascending structure near $76.5K-$77K and quickly tested the $81K-$82K area, only for sellers to reject the move once again.
Price subsequently dropped toward $79.5K and has entered a tight short-term consolidation. This creates a notable contrast between the rising channel structure and the repeated failures near its upper boundary. Buyers are still defending higher lows, but they have yet to demonstrate enough momentum to convert the $80.5K-$82.5K supply area into support.
The $76.5K-$77.5K region therefore remains crucial. Another test of this zone could determine whether the ascending structure survives. A strong reaction would keep a renewed push toward $81K-$82K in play, whereas a breakdown would indicate that the consolidation is transitioning into a deeper corrective phase.

Sentiment Analysis
The one-week BTC liquidation heatmap shows substantial liquidity on both sides of the current price, which supports the possibility of continued choppy trading and liquidity sweeps.
Above the market, notable liquidation concentrations appear around $81K-$82K and extend toward approximately $84K. These clusters could attract price if buyers regain momentum.
However, the downside liquidity is particularly relevant following the latest rejection. A broad and comparatively dense concentration is visible below the market, especially around the $76K-$78K region. This aligns closely with the lower boundary of the ascending technical structure.
As a result, a downside liquidity sweep toward $76K-$78K remains a plausible near-term scenario before another recovery attempt. Such a move would not automatically invalidate the broader bullish setup, but a sustained breakdown beneath this region would increase the probability of a deeper retracement toward the $72K-$74.5K support zone.

The post Bitcoin Price Analysis: The Good and the Bad for BTC After Latest $82.4K Rejection appeared first on CryptoPotato.